Your Users Aren't Running Supercomputers: 10x Performance Gains
5 minute read

Jacob Wheale
Senior Engineer

The interactive globe provides an at-a-glance view of the geographical distribution of data and allows users to drill down by selecting one or more countries. For this client, that means visualising their global adoption, tracking prospect distribution, and spotting potential opportunities for growth — insight that supports their strategy of *strong, prudent, organic growth*. We deliberately chose a 3D globe instead of a basic dropdown to enhance the experience, add meaningful functionality, and create a strong "wow" moment on first use.
But a "wow" moment only works if it actually performs. A visualisation that stutters, drains laptop batteries, or takes ten seconds to load risks becoming a frustration rather than a feature—something users avoid rather than engage with. Our hypothesis: by optimising for real-world hardware, we'd ensure the globe delivers on its promise, encouraging users to explore and interact rather than skip past it.
When we shipped our interactive analytics globe, it worked beautifully on our development machines. Countries displayed heatmap data, tooltips appeared on hover, rotation felt responsive.
Then we tested it on a mid-range laptop.
The fans spun up. The browser tab consumed 100% CPU—just sitting there, idle. Frame rates plummeted during interaction. What felt premium on a developer's device felt sluggish on the kind of hardware most of our users actually have.
This is the story of how we transformed that globe from a resource hog into something that uses near-zero CPU when idle and runs at 200+ fps even on throttled hardware—while cutting load times in half.

The Comfortable Starting Point
Like many teams, we reached for an established library: react-globe.gl a well-maintained React wrapper around Three.js. It gave us a working globe in hours, complete with polygon-based country rendering, built-in hover detection, and smooth animations.
The library uses GeoJSON polygons to draw country shapes—a sensible default that works well for many use cases. But as we layered on our requirements (heatmap colouring, accurate tooltips, textured surfaces), cracks began to show.
The first red flag: tooltip hover detection had gaps. Move your cursor over certain areas and... nothing. Small countries were hard to hit—some were missing entirely. The polygons, it turned out, didn't quite match the visual boundaries users expected.
The second red flag: performance. We use Chrome DevTools' CPU throttling (6x slowdown) to simulate lower-powered devices. Our globe crawled at 20-30 fps during interaction. Idle, it still churned away rendering every frame it could—doing nothing, but burning battery and hogging resources regardless.
Peeling Back the Abstraction
The turning point came when we stopped treating the library as a black box.
React-globe.gl is built on Three.js, a powerful 3D library. But the React wrapper, while convenient, made certain assumptions that didn't fit our needs. The continuous animation loop—great for auto-rotating demos—was wasteful for our use case where the globe mostly sits still, waiting for user interaction.
We started by keeping the library but taking control of the Three.js scene underneath it. We swapped the flat polygon rendering for a proper 3D model (an OBJ file with individual country meshes), added bump-map textures for visual depth, and implemented our own raycasting for hover detection.
The results were immediate: tooltips now followed the cursor precisely, even for tiny island nations. Small countries that had been missing from the polygon data now appeared correctly. The visual quality improved dramatically. But we'd also added complexity—and performance actually got worse before it got better.
We were now running two rendering systems in parallel: the library's polygon layer (invisible, but still being calculated) and our custom Three.js meshes. It worked, but it was like running two engines to power one car.
The Breakthrough: Less Is More
The real gains came from a simple realisation: we didn't need the library at all anymore.
We ripped out react-globe.gl entirely and built directly on Three.js. This gave us something the wrapper couldn't: on-demand rendering.
Instead of a continuous animation loop redrawing the scene 144 times per second regardless of whether anything changed, we now render *only when the user interacts with the globe. Mouse drag? Render. Resize the window? Render. Globe sitting idle while you read the dashboard? Zero renders. Near-zero CPU.
This single change dropped idle CPU usage from 100% to under 10%.
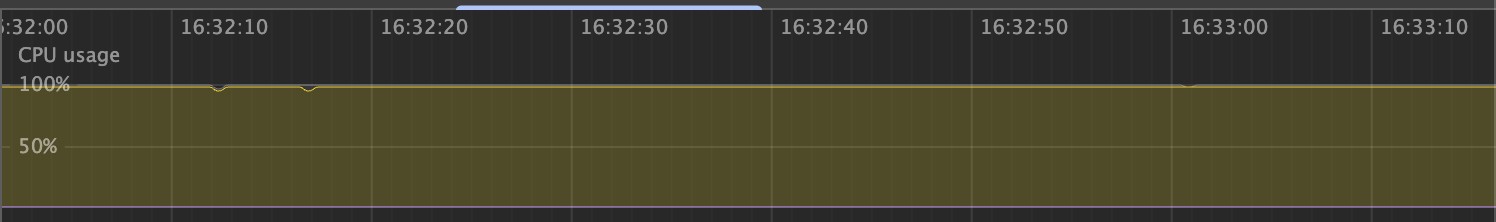
Before: 100% CPU usage while the globe sits completely idle. The browser is rendering frames of nothing changing.
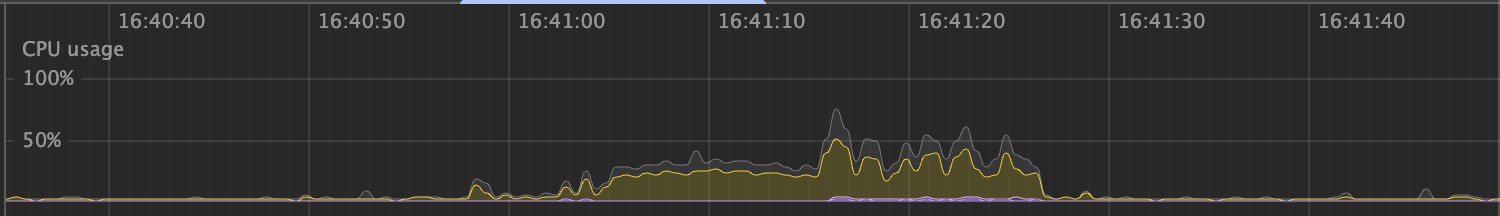
After: Near-zero CPU at idle. The spikes in the middle? That's the user actively rotating the globe. When they stop, so does the work.
Both screenshots captured with 6x CPU throttling at 60Hz — conditions representative of a typical user's hardware.
But we weren't done.
Death by a Thousand Draw Calls
Profiling revealed another bottleneck: draw calls. Every country border was being rendered as a separate line — roughly 200 individual draw calls per frame. GPUs are fast, but they're fast at drawing lots of triangles in few calls, not few triangles in lots of calls.
The fix was geometry merging. Instead of 200 separate border line segments, we combined all border coordinates into a single buffer and drew them in one call. Same visual result, fraction of the GPU overhead.
We applied similar thinking elsewhere:
Pre-allocated vectors for raycasting calculations, eliminating garbage collection pressure from creating new objects every mouse move
Skipped hover calculations entirely while dragging—if you're rotating the globe, you don't need tooltip detection
Cached bounding rectangles instead of recalculating them on every mouse event
Each optimisation was small. Together, they were transformative.
The Numbers
Here's where we ended up, testing with 6x CPU throttling to simulate real-world devices:
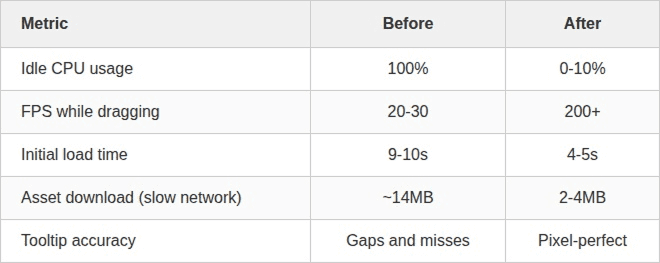
On a high-refresh-rate test display (240Hz), the optimised globe hit 200+ fps during interaction. More importantly for real users, it comfortably maintains 60 fps on typical hardware—the ceiling for most laptop and desktop displays.
What We Learned
Libraries are starting points, not destinations. React-globe.gl got us to a working prototype fast. But when performance became critical, we needed to understand—and eventually replace—the abstractions it provided.
Test on slow hardware. Developer machines are a lie. CPU throttling in DevTools, testing on older devices, monitoring actual user metrics—these reveal the truth about your application's performance.
Idle costs matter. A visualisation that burns CPU while doing nothing isn't just inefficient; it drains laptop batteries, spins up fans, and makes your entire application feel sluggish. On-demand rendering should be the default for any interactive-but-mostly-static UI.
Small optimisations compound. No single change gave us 10x improvement. It was the combination: on-demand rendering, merged geometry, skipped calculations, parallel loading, asset caching. Each shaved off milliseconds that added up to a transformed experience.
The globe now sits quietly in the dashboard, waiting. When users interact with it, it responds instantly. When they don't, it costs them nothing.
That's the goal: technology that serves users on their hardware, not just ours.
Enterprise JavaScript
Product Design
Product Development